Last Updated on January 14, 2025 7:09 am by Admin
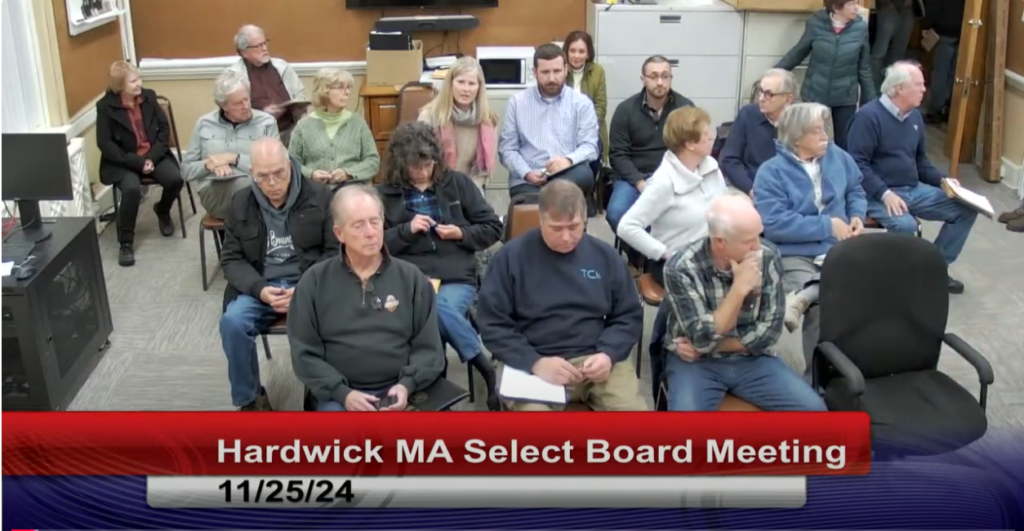
The new Head Of School, Ms. Erin Wynne, had the temerity to appear at the November 25, 2024 Hardwick MA Select Board Meeting and to claim that it is “financially not even possible for Eagle Hill “ to pay more for its “PILOT” agreement. (Click to view on YouTube)
Data From IRS Forms 990
Below is a summary of the IRS Forms 990 for Eagle Hill Foundation Of Massachusetts along side the “PILOT” payments (“gifts”) from Eagle Hill to the town. It is amazing how they have gone from $13 million to over $100 million in total assets in the past two plus decades.
I split this table in two to make it easier to see on mobile devices. Here are the numbers from the available IRS 990 forms from 2000 to 2022:
| Year | Revenue | Expenses | Net Income | Net Assets | Total Assets | Total Liabilities | Head Of School Salary |
|---|---|---|---|---|---|---|---|
| 2000 | $6,421,071 | $5,154,211 | $1,266,860 | $6,606,923 | $13,225,487 | $6,618,564 | $195,572 |
| 2001 | $5,152,448 | $4,841,582 | $310,866 | $7,038,730 | $10,219,289 | $3,180,559 | $187,155 |
| 2002 | $6,622,853 | $5,509,075 | $1,113,778 | $8,315,435 | $12,206,952 | $3,891,517 | $198,696 |
| 2003 | $6,788,469 | $5,858,324 | $930,145 | $9,537,613 | $19,768,695 | $10,231,082 | $204,265 |
| 2004 | $9,010,525 | $6,697,734 | $2,312,791 | $11,095,472 | $22,153,257 | $11,057,785 | $241,512 |
| 2005 | $9,779,041 | $7,870,619 | $1,908,422 | $13,075,363 | $24,214,510 | $11,139,147 | $274,001 |
| 2006 | $16,197,166 | $8,419,156 | $7,778,010 | $21,193,807 | $32,686,529 | $11,492,722 | $344,842 |
| 2007 | $15,780,013 | $8,809,843 | $6,970,170 | $26,999,481 | $43,973,713 | $16,974,232 | ??? |
| 2008 | $10,375,418 | $10,221,573 | $153,845 | $26,930,684 | $44,771,519 | $17,840,835 | $315,810 |
| 2009 | $13,291,634 | $11,364,680 | $1,926,954 | $29,316,357 | $44,832,983 | $15,516,626 | $328,844 |
| 2010 | $13,697,540 | $12,679,812 | $1,017,728 | $31,092,499 | $46,311,603 | $15,219,104 | $341,960 |
| 2011 | $16,216,345 | $13,111,377 | $3,104,968 | $33,752,685 | $50,432,485 | $16,679,800 | $470,022 |
| 2012 | $16,412,414 | $14,086,694 | $2,325,720 | $36,303,550 | $65,403,772 | $29,100,222 | $470,022 |
| 2013 | $19,095,900 | $15,891,798 | $3,204,102 | $39,767,359 | $69,137,381 | $29,370,022 | $466,149 |
| 2014 | $21,220,470 | $19,385,994 | $1,834,476 | $41,524,069 | $70,513,872 | $28,989,803 | $456,667 |
| 2015 | $20,422,879 | $18,349,901 | $2,072,978 | $43,560,315 | $72,115,164 | $28,554,849 | $512,064 |
| 2016 | $20,885,339 | $18,408,486 | $2,476,851 | $46,325,249 | $73,415,041 | $27,089,792 | $534,639 |
| 2017 | $24,064,610 | $18,717,654 | $5,346,956 | $51,678,334 | $78,174,675 | $26,496,341 | $701,053 |
| 2018 | $23,349,372 | $19,079,879 | $4,269,493 | $55,958,591 | $86,064,692 | $30,106,101 | $489,696 |
| 2019 | $23,024,967 | $19,024,176 | $4,000,791 | $59,893,815 | $87,454,244 | $27,560,429 | $486,769 |
| 2020 | $29,673,170 | $19,783,511 | $9,889,659 | $71,528,455 | $96,499,994 | $24,971,539 | $650,137 |
| 2021 | $24,485,162 | $21,136,187 | $3,348,975 | $71,300,636 | $95,855,505 | $24,554,869 | $600,244 |
| 2022 | $26,800,193 | $21,234,415 | $5,565,778 | $78,112,847 | $102,861,586 | $24,748,739 | $823,412 |
| 2023 | |||||||
| 2024 |
I added this table of the PILOT payments for visitors on mobile devices with smaller screens:
| Year | PILOT Payment | % of Revenue | % of Income | % of Assets | % of Head Of School Salary |
|---|---|---|---|---|---|
| 2000 – 2015 | Waiting for Public Records Request to be Fulfilled Apparently these records are difficult to retrieve. | ||||
| 2016 | $40,841.15 | 0.20% | 1.65% | 0.06% | 7.64% |
| 2017 | $46,737.60 | 0.19% | 0.87% | 0.06% | 6.67% |
| 2018 | $51,097.18 | 0.22% | 1.20% | 0.06% | 10.43% |
| 2019 | $53,156.56 | 0.23% | 1.33% | 0.06% | 10.92% |
| 2020 | $55,549.73 | 0.19% | 0.56% | 0.06% | 8.54% |
| 2021 | $61,661.61 | 0.25% | 1.84% | 0.06% | 10.27% |
| 2022 | $16,511.00 | 0.06% | 0.29% | 0.02% | 1.94% |
| 2023 | $53,297.00 | | | | |
| 2024 | $56,890.00 | | | | |
WOW! It would be hard to match that salary for the “Head of School” job in 2022 and I am still waiting for the 2023 & 2024 990 forms to see what it is now. What do you think of those PILOT payments? Considering that it costs the town around $20,000 per year per kid to attend Hardwick Elementary or Quabbin Regional, those payments don’t go very far at all.
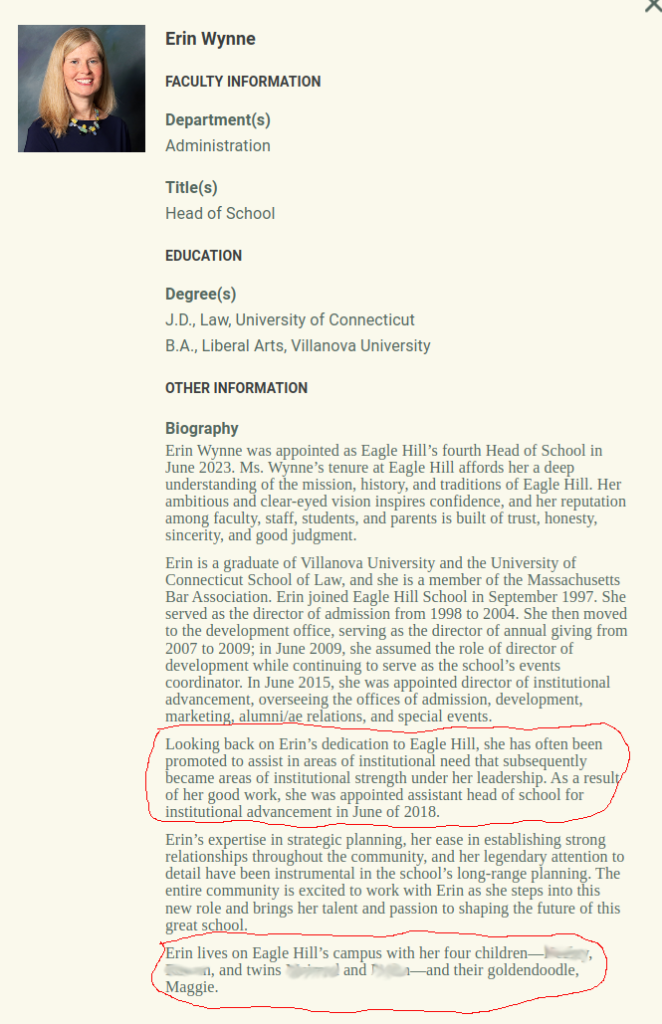
I wonder how many of Ms. Wynne’s four children attend Hardwick Elementary or Quabbin Regional High School? What about those other faculty members living on campus? I know this is a little redundant from the numbers above, but here are the salary figures for “Head Of School” AND “Assistant Head Of School” since 2018:
| Year | Assistant Head Of School | Head Of School | Total |
|---|---|---|---|
| 2017 | $171,326 | $783,628 | $954,954 |
| 2018 | $175,588 | $489,696 | $665,284 |
| 2019 | $176,567 | $486,769 | $663,336 |
| 2020 | $188,466 | $650,137 | $838,603 |
| 2021 | $200,598 | $600,244 | $800,842 |
| 2022 | $259,258 | $823,412 | $1,082,670 |
Interested in the other “Highly Compensated Employees”? Have a look over here: https://www.sonsoflibertyma.com/2025/01/13/eagle-hill-school-highest-compensated-employees/
Financial Statements
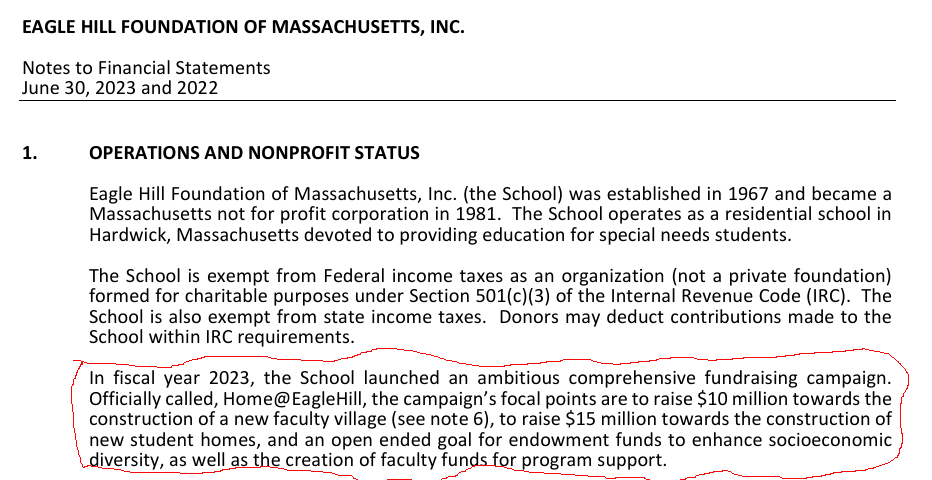
Below is the most recently filed financial statement for Eagle Hill School. In it you will find the word “Hardwick” occurs only one time, when referring to the school’s location. The word “PILOT” does not appear at all. It seems that if any payment or gift was made to the town, it was deemed insignificant enough to be part of a “miscellaneous” category and it is not specifically mentioned.
Not only does Eagle Hill School not acknowledge in any way the PILOT agreement with the town in their financial statements, they have “ambitious” plans to expand their property tax exempt housing for their faculty. The image below is taken from the financial statement document above:
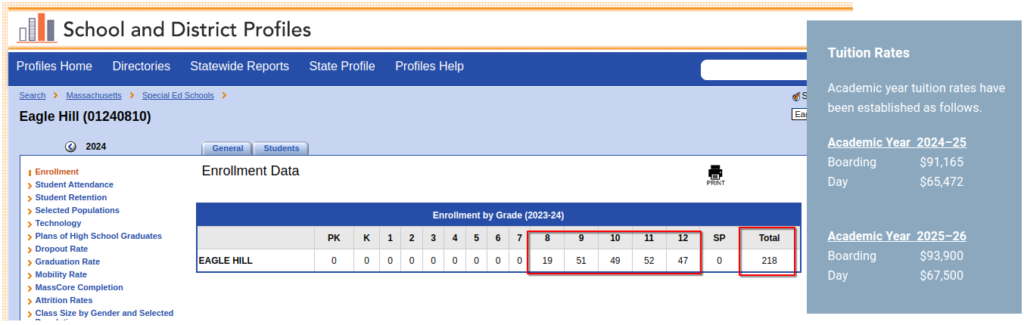
Checkout how much it costs to attend Eagle Hill School:
School Lunch Reimbursement
Why does such a wealthy school with such high tuition and fees need to apply to the state for lunch money? Also from the IRS Form 990, here are the amounts of money given to Eagle Hill School for Student Lunches from the state of Massachusetts tax payers along side the PILOT payments:
| Year | Massachusetts Department Of Education Bureau Of Nutrition For Reimbursement Of Meals Provided To Students | PILOT Payment |
|---|---|---|
| 2006 | $34,315 | |
| 2007 | ? | |
| 2008 | ? | |
| 2009 | ? | |
| 2010 | $135,403 | |
| 2011 | $142,975 | |
| 2012 | $169,674 | |
| 2013 | $165,323 | |
| 2014 | $166,680 | |
| 2015 | $171,812 | |
| 2016 | $170,251 | $40,841.15 |
| 2017 | $130,777 | $46,737.60 |
| 2018 | $173,154 | $51,097.18 |
| 2019 | $111,542 | $53,156.56 |
| 2020 | $147,787 | $55,549.73 |
| 2021 | $203,126 | $61,661.61 |
| 2022 | $153,508 | $16,511.00 |
It’s almost as if we tax payers paid Eagle Hill School more than Eagle Hill School paid us.
Original “kitchen sink” post with all the data is here: https://www.sonsoflibertyma.com/2024/12/29/the-town-services-you-pay-for/